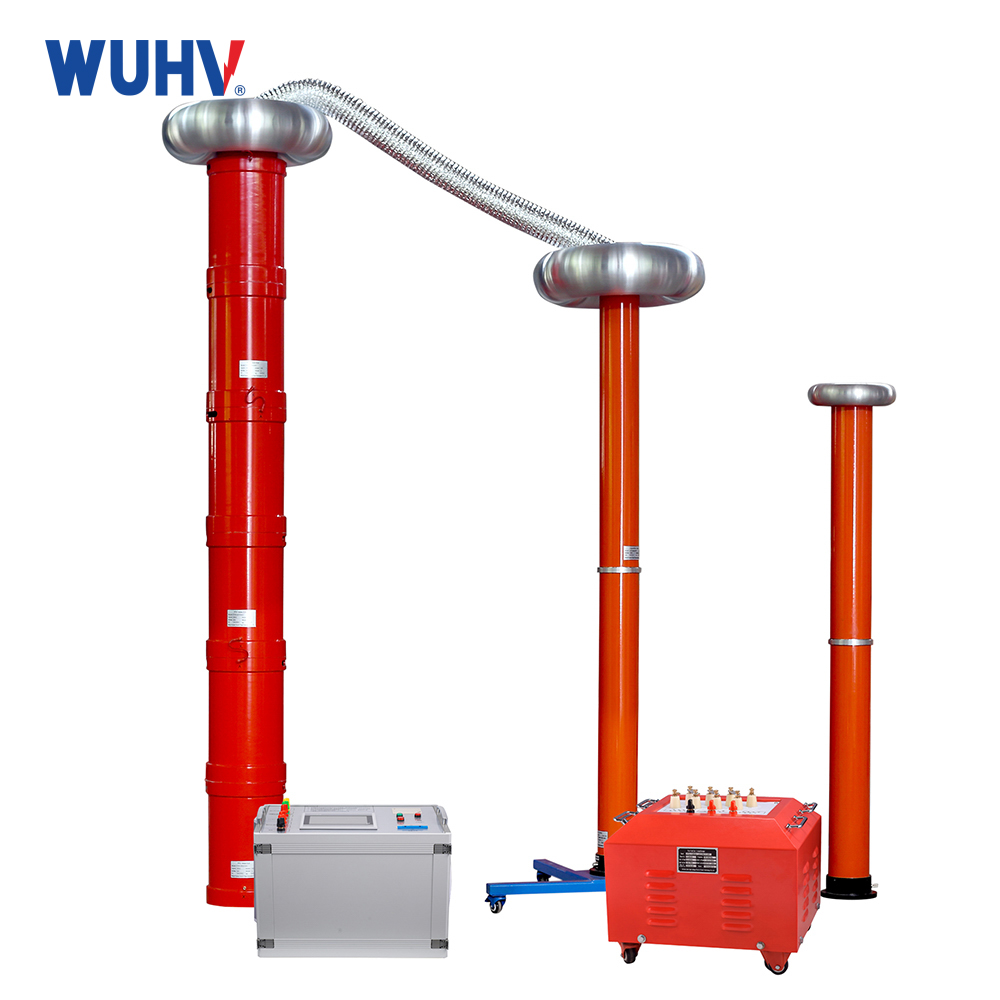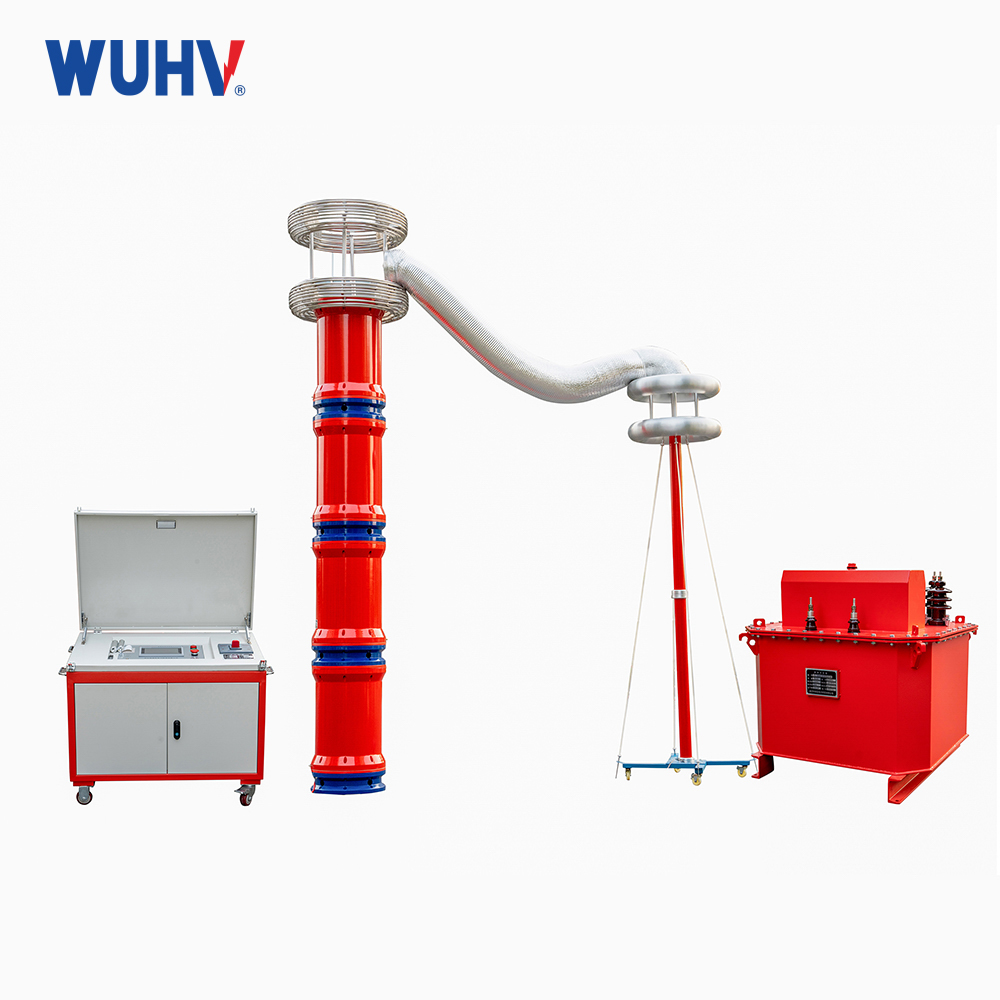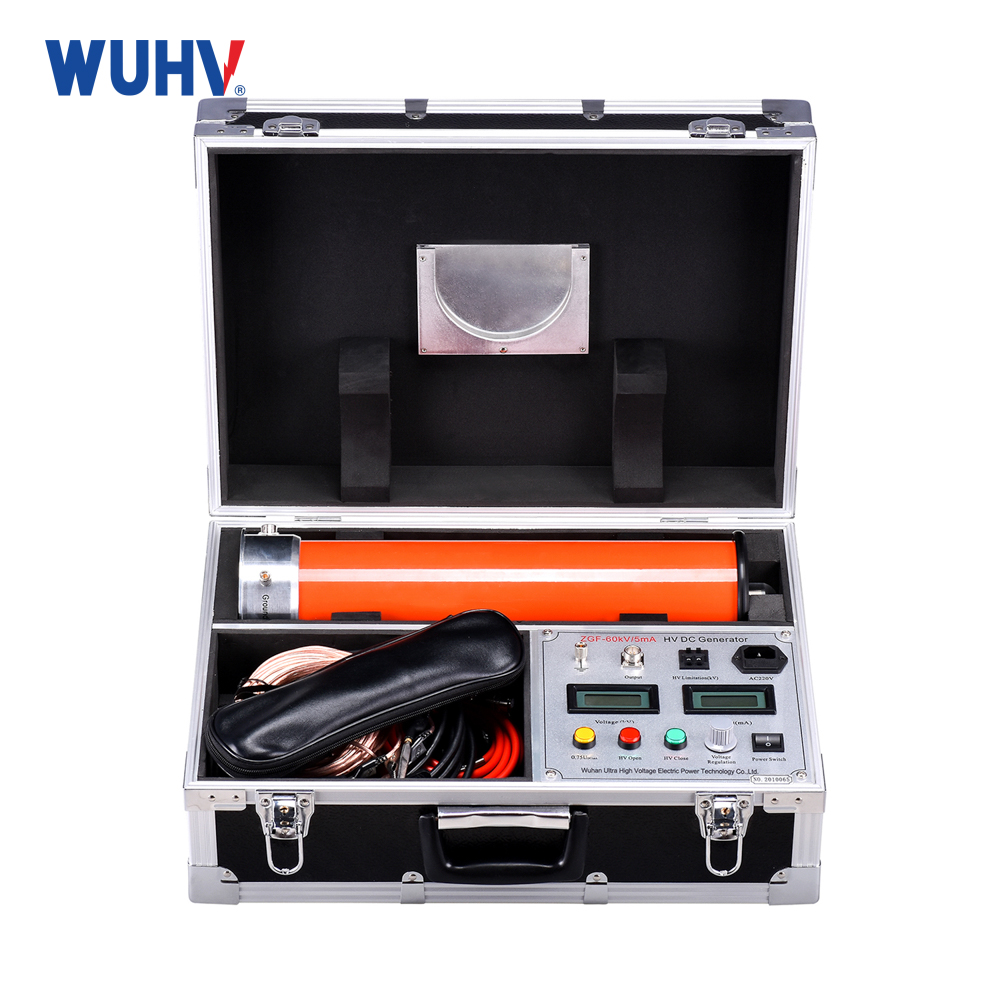
The waveform recorder under UHV power can help many power workers conduct various power tests more conveniently.

1. Overview
The test procedure for the voltage frequency characteristics of the excitation system is as follows:
Click on the excitation system voltage frequency characteristic button on the main interface ->Set test parameters ->Set oscilloscope environment ->Channel calibration ->Start test ->End test ->Test data analysis and processing
2. Application
The voltage frequency characteristic test of the excitation system is used to evaluate the generator excitation system and draw a relationship diagram between the excitation system voltage and frequency.
3. Test connection
Connect the test line to the parameter setting interface according to the relationship diagram to obtain the test signal
1> Connect the unit frequency transmitter signal to the instrument signal input channel CH1
2> Connect the PT secondary side of the A camera terminal voltage to the CH2 channel of the instrument
The CH2 channel is the secondary side of the voltage PT at the A camera terminal, and the instrument displays the AC effective value, while CH1 displays the DC effective value
4. Test parameter settings
The sampling frequency for frequency voltage characteristic testing is 25kHz, the oscilloscope displays a frequency of 25Hz, the AC signal displays the effective value, and the DC signal displays the average value within 40ms.
When testing the frequency and voltage characteristics of a generator, the parameters that need to be input include automatic or manual data recording, the step size of automatic data recording, and the frequency change direction corresponding to the data recording. The direction of frequency change refers to whether the frequency increases or decreases during the testing process.
5. Testing process
After the test connection is completed, turn on the generator to put it in an unloaded state, adjust the unit speed to the test starting frequency, start the testing process, then increase or decrease the speed, record some key points during the process, and stop testing data collection when the frequency change reaches the cut-off point.
6. Parameter calculation and result display explanation
The test results obtained in this experiment are characteristic curves of the relationship between frequency and voltage.